
Important links
Abstract
Context: Owing to the interaction between genotype and environment (G x E), identifying traits to increase wheat yield and grain protein concentration simultaneously or increasing one without affecting the other remains a challenge. Phenotypic plasticity is an insightful perspective to understand G x E. Objective: To explore the relations of wheat yield and grain protein concentration in response to N input and its physiological basis from the perspective of phenotypic plasticity. Method: We established a factorial experiment combining 14 winter wheat cultivars and four N fertilization rates (0, 45, 90 and 135 kg ha-1) in eight environments. We analyzed the interaction of cultivar and N combining a phenotypic plasticity framework and a three-phase model of grain yield and protein response to N input. The phases are: phase I, N supply limits both yield and grain protein; phase II, N supply limits grain protein but not yield; and phase III, N supply does not limit yield or grain protein concentration Results: Grain yield plasticity was positively associated to yield in high-yielding environments without N limitations (phase II) with no cost in low yielding environments, and associated to harvest index. Grain protein plasticity was a positively associated to protein in high protein environments without N limitations (phase III). Plasticity of grain protein concentration was negatively associated to grain number m-2, resulting in moderate negative association of protein plasticity and yield. Grain C:N ratio associated weakly and positively with yield plasticity and strongly and negatively for grain protein plasticity. Conclusion: This work proposes a yield-protein plasticity framework combined with a three-phase model that allows to disclose G × N interactions. Under our experimental conditions, we identified physiological mechanisms associated to yield and protein plasticity. Implications: Yield and protein plasticity can contribute guiding grower’s cultivar selection towards high yield plasticity cultivars when aiming to high yield with acceptable protein levels or high protein plasticity cultivars to ensure high protein at the expense of lower yields. Yield plasticity brings opportunity to breed for high yielding cultivars while maintaining grain protein concentration. Accuracy of N recommendations models and mechanistic crop models can be improved by accounting for G × N interactions through plasticity of yield and grain protein.
Figure
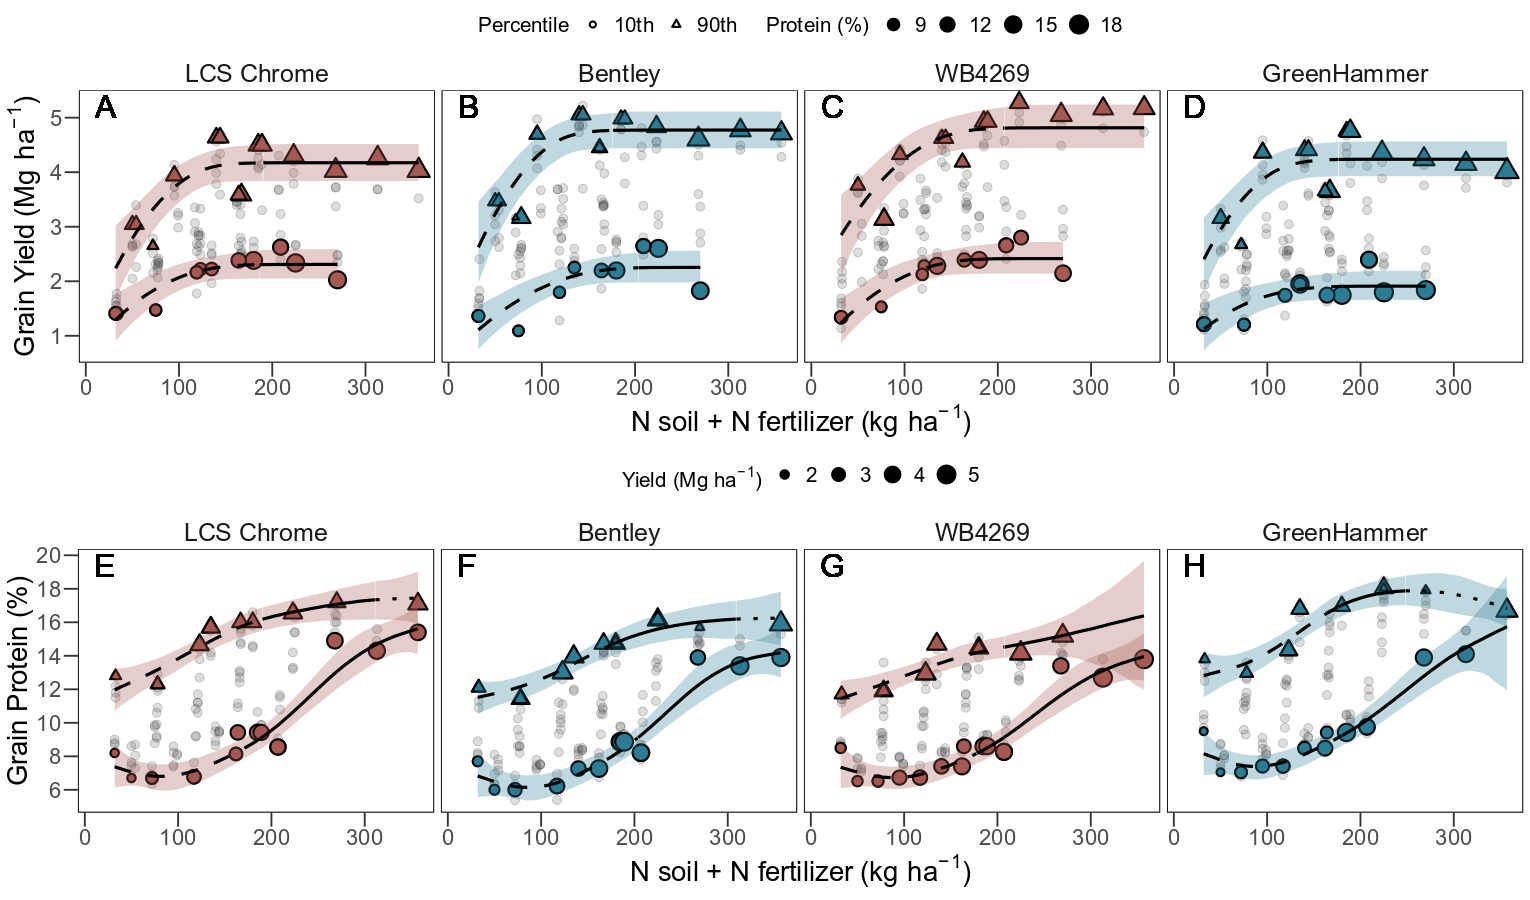
Fig. 5: Wheat grain yield (A-D) and protein (E-F) response to N supply under conditions conducive to high (90th percentile, triangles) and low (10th percentile, circles) trait expression for cultivars with contrasting phenotypic plasticity. Red symbols are for cultivars with low plasticity for yield (LCS Chrome) and protein (WB4269), and blue is for cultivars with high plasticity for yield (Bentley) and protein concentration (Green Hammer). Linetype indicates the phases conceptualized in Figure 2: dashed (phase I), solid (phase II), dotted (phase III). Lines represent the posterior medians and ribbons the 95% estimation credible interval for model predictions. The size of the symbol shows protein concentration in the yield panels (A-D) and yield in the protein panels (E-H).
Citation
@article{GiordanoSadrasCorrendoLollato:2023,
    Author = {Nicolas Giordano, Victor O. Sadras, Adrian A. Correndo and Romulo P. Lollato},
    Doi = {10.1016/j.fcr.2023.109202},
    Journal = {Field Crops Research},
    Month = {1},
    Number = {108740},
    Title = {Cultivar-specific phenotypic plasticity of yield and grain protein concentration in response to nitrogen in winter wheat},
    Volume = {306},
    Year = {2024}}